AmiBroker Strategy Development and AutoTrading
(Strategy Presentation begins in the video at the end of the blog post at the 36:08 timestamp mark).
Pre-Amble
I recently did a presentation on AmiBroker Strategy Development and AutoTrading. You can find the recording below at the end of this post, starting at 36:08 in the video.
I can't write a blog post explaining the ENTIRE process, so instead I suggest that you watch the presentation below for more context and refer to the slide deck starting at slide 19. This presentation was actually two (2) Sessions. If you are interested in the first session on "A Super Easy Way to Work With Dates for Monthly Rotation Strategies in AmiBroker", you can link to that here.
However, I'd like to highlight some of the key slides, data and points below from the slides, for reference. I've also provided links (below) to download the important files discussed in the presentation that you can use for your own starting Strategy templates and related files.
Objectives
a) Provide a decent starting strategy template for those that want to develop strategies in AmiBroker.
b) Review the Strategy Rules and Backtest Results of the CCI Correction Strategy from StockCharts.com.
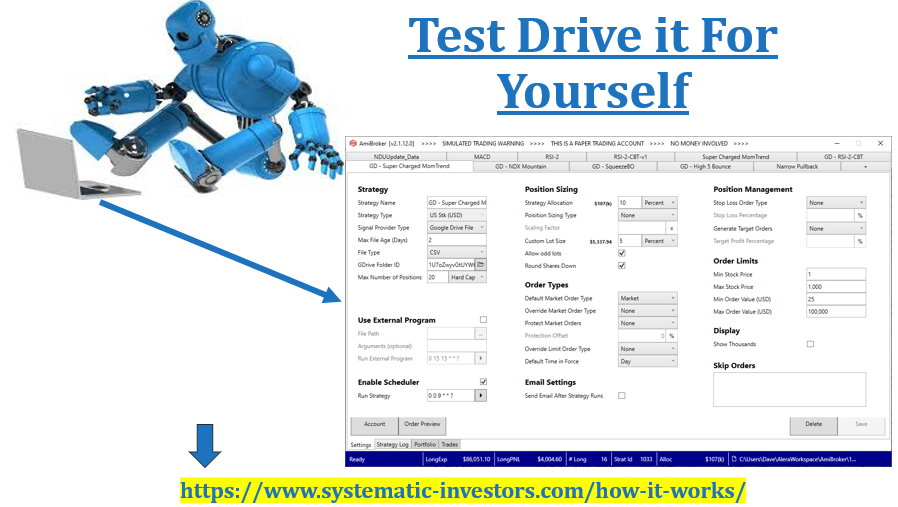
c) Provide a clear path and integration case study showing how to semi and fully automate strategies using the software tools AmiBroker + Alera Portfolio Manager (APM) -- https://aleratrading.com
Background and Case Study
Doug D is a long-time friend that I met in the Technical Analysis community through the CSTA.org years ago. He’s a Technical Analyst and has been using various TA indicators over the years. He’s now ready to take the next step and venture into Quantitative Technical Analysis. This will allow him to verify and quantify some trading ideas – also, to get some data on how well some of the indicators he uses, work. Doug wants to learn how to use AmiBroker for these trading ideas.
Doug isn’t unique, many traders get to this stage (as did I several years ago) and need some guidance in getting started. That’s what we’ll do here today.
Doug sent me an idea that is close to one of his strategy interests, called the CCI Correction Strategy from www.stockcharts.com . This will be a good Case Study to use! The direct link to the Strategy is...
Strategy Summary
The CCI Correction Strategy is based on the Commodity Channel Index (CCI) indicator developed by Donald Lambert, which is a momentum oscillator that can be used to identify a new trend or warn of extreme conditions.
The Strategy…
- Uses a Weekly CCI to dictate the trading (trend) bias. When it surges above +100 it gives a long trend bias. When it plunges below -100 it gives a short trend bias, key levels noted by Lambert.
- Uses a Daily CCI to dictate a short-term pullback against the predominant trend (i.e. the trade trigger) that represents an entry opportunity.
Trading Strategy (System) Rules
1. Define the bigger trend and trading bias. CCI surge above +100 on the weekly chart denotes an Uptrend or bullish bias, which remains until surges below -100. CCI weekly surge below -100 denotes a Downtrend or bearish bias.
Note: Can also use longer time frame CCI on the daily chart instead of the weekly CCI, for example, use a 100 period CCI on the daily instead of a 20 period CCI on the weekly for trending bias. (Easier since don’t have to use timeframe functions in AmiBroker. Note: we did decide to use timeframe functions).
2. Wait for smaller countertrend movement. Use the daily chart to time oversold pullbacks when weekly chart dictates a bullish bias. -100 CCI reading on the Daily chart reflects a pullback within the bigger uptrend.
3. Look for a reversal of this countertrend movement. A surge back into positive territory (i.e. CCI cross over of the zero line on the Daily chart) will be the trigger signal to enter. (This is essentially the “trade trigger”.)
Taking Profits and Stops
When developing a Strategy/System, some of the most difficult considerations that will affect profitability are when to take profits and when to cut losers! Included is the below comment from the Strategy page…
“Also, note that the CCI correction strategy is not meant as a stand-alone system. Chartists need to consider how to implement stop-losses, when to take profits and how to tailor the strategy to their own goals and trading style. More aggressive traders could prefer a shorter look-back period to generate quicker signals, while less aggressive traders might prefer a CCI surge above +100 to generate signals on the short timeframe. Keep in mind that this article is designed as a starting point for trading system development. Use these ideas to augment your trading style, risk-reward preferences and personal judgments.”
Taking Profits and Stops
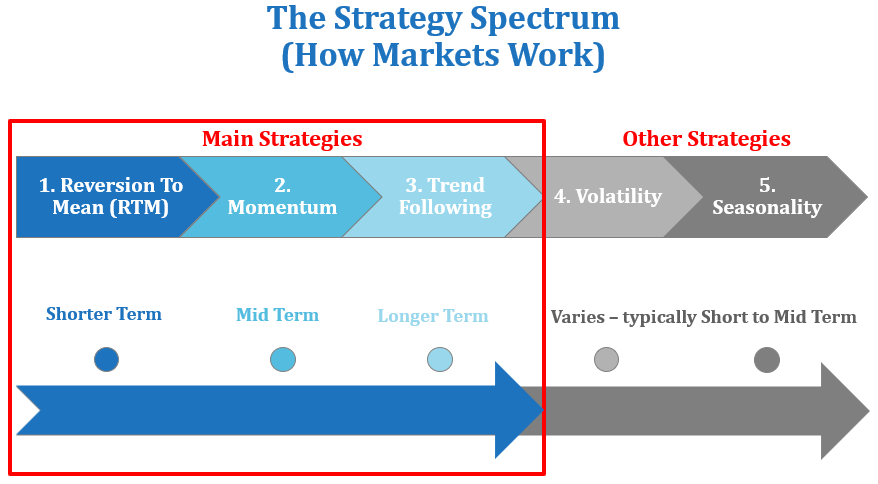
Our approach to determining an exit was to keep things simple. Since this is a Reversion To Mean type Strategy, and we are buying pullbacks on oversold conditions, we simply decided to sell when things became “overbought” according to the CCI indicator (+100 on the Daily chart).
Long Only - No Shorting
We focus on long-side trading only and not short-side trading for this Strategy.
Why?
- Some stocks are hard to borrow short, and there is no guarantee of consistent fills when shorting.
- The “market” has a positive drift bias, it goes up ~57%+ of the time.
- When markets get volatile, some countries or exchanges have been known to ban short-selling.
- Bull markets last much longer than bear markets on average!
- To simplify the demonstration / presentation!
Pre-Conditions
Trading Universe = Nasdaq 100 (Current & Past)
- “the 100 stocks that comprise the Nasdaq 100 index” today, and, the 100 stocks that comprise the Nasdaq 100 in the past on any given trading day.
Max Number of Portfolio Positions = 10. (* Portfolio based position sizing)
- We are trading a portfolio of stocks allowing up to 10 portfolio positions.
- For the total capital allocated to the strategy, each position is equal weighted 1/10th of the total portfolio allocation.
- Example $20,000. $2,000 max per stock position.
Pre-Conditions - Regime Filters & Ranking
The Strategy uses a simple “Macro Regime Filter” for…
Market Timing.
- No extra filters, just CCI Weekly timing described earlier.
Signals are “Ranked”.
- In the case of too many signals versus number of “slots available” in the portfolio, some signals are given priority over other signals based on a ranking algo.
- Ranking Algo is simply ROC(Close, 60) i.e. the Rate Of Change of the last 60 days on a closing basis.
Implementation - EOD
- The CCI Correction Strategy is an End Of Day (EOD) Strategy and does not use live intraday market data to make decisions.
- All decisions are made after the market closes.
- Execution takes place the next day – entries are Market On Open (MOO), and, exits are also Market On Open (MOO) orders.
- “Live” orders should be in the market at least 15 minutes before the open, giving enough time to get matched and executed during the “open auction” process.
- Opening prices should match up well with backtesting and charting software.
So, all buy and sell rules wait for confirmation of closing prices and conditions at the end of the day, for execution next day (1 day trade delay).
Why? Because this allows for practical and realistic execution, no look ahead bias or difficult to execute trades.
This ensures less chance of logical errors being introduced into live trading conditions.
The Code
* Click Here to Download the GenSignals Helper File for AmiBroker
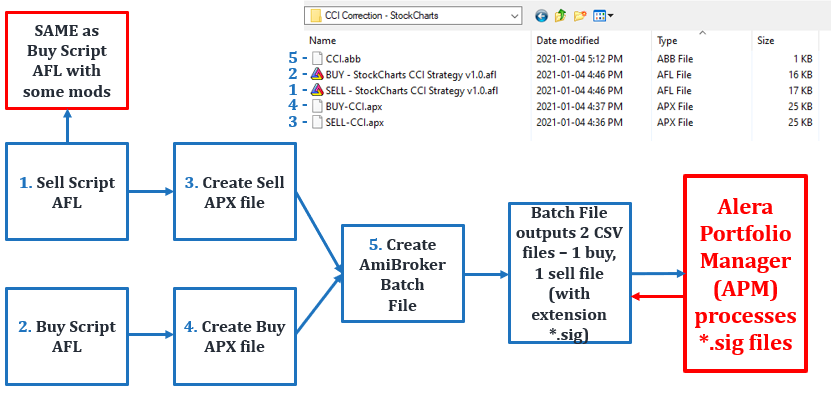
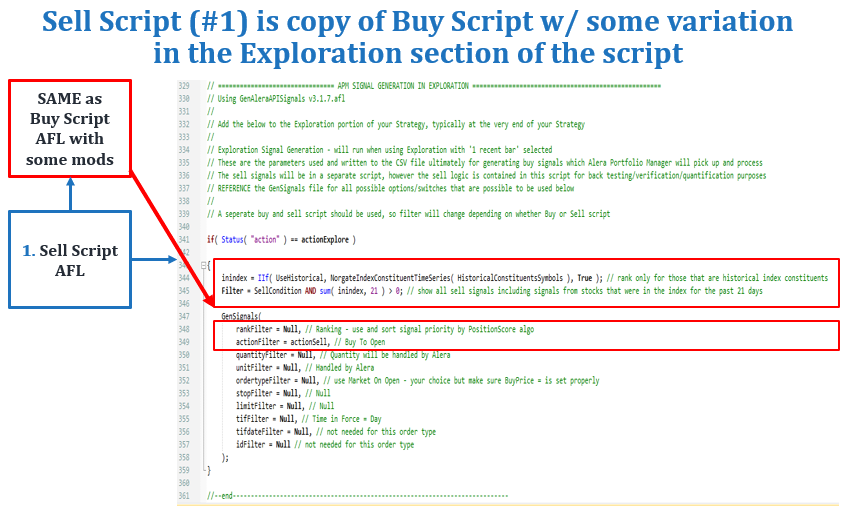
- This file should go in your 'Include' directory and contains the GenSignals function file and is used to generate the Exploration needed for Alera Portfolio Manager. The function is called in the Exploration code sections of the below Strategy (Scan) Code files (in both Buy and Sell Strategy/Scan code).
* Click Here to Download the "Buy" Scan Code
- This is the same code that will be used for both Backtesting and for running the Buy Exploration.
* Click Here to Download the "Sell" Scan Code
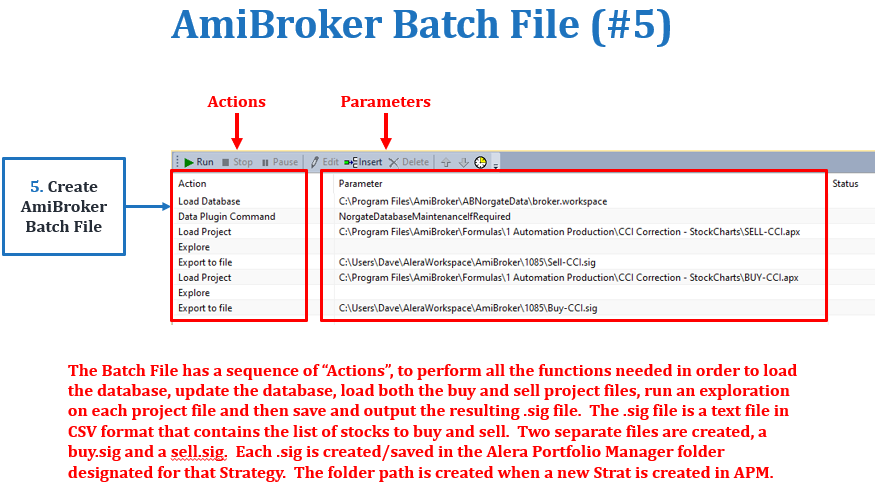
* Click Here to Download the AmiBroker Batch File
- This file will need to modified so that the file paths to your own files match your own file system.
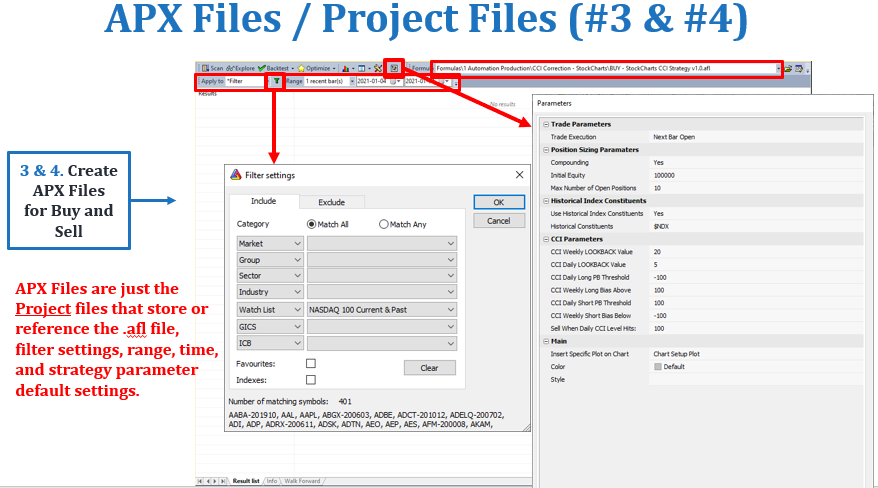
* APX (Project Files).
- You will need to create your own APX (Project files) using the directions in the presentation video below. (Also see the below screen shots on APX files)...
Backtest Results of the CCI Correction Strategy...
Assumptions
- Initial Capital - $100,000 account size
- 10 maximum positions
- 1/10th Equal Weight per Position
- Daily Bars (Time Frame)
- From Jan 1st 2000 until present ( ~ 20 years)
- Universe – Nasdaq 100(Current & Past) using Index Constituents
- Commissions of approx. 1 cent per share
Portfolio Approach
- “Compounding” set to “Yes” in Position Sizing Parameters means we are running a Portfolio Backtest, “No” means an “All Trades Test”.
- A portfolio approach is used, rather than just trading 1 instrument at a time.
- Assumes that when “spots” open up, the next available trade setup that is matched (and ranked) will fill the available spot in the portfolio.
- Many different symbols used. Less chance to curve fit when using a portfolio approach (vs 1 symbol). More robust. Diversifies risk.
- Portfolio Backtest approximates what would have happened from the start date if trading proceeded in a continuous manner. Mimics real world conditions.
- Portfolio Trading == Better risk management through position sizing, larger sample sizes, more opportunities, diversified risk, and is more robust.
Key Backtest Metrics
- CAR % – Compounded Annual Return (average)
- Exposure %
- Risk Adjusted Return %
- Total Trades (sample size)
- Average Profit/Loss % (Expectancy %)
- Winners % (Win Rate)
- Maximum Draw Down (MDD) %
- CAR/MaxDD (aka MAR Ratio)
- Payoff Ratio
- Portfolio Equity Curve
- Underwater Equity
- Profit Table
Backtest Report
The backtest report is described in the presentation video at the end of this post, starting at timestamp 1:37:18.
Generate Signals
I hope this is helpful for those that are interested in developing their own Strategies using AmiBroker, and also, for those that want to go to the next level and implement their own AutoTrading!
We also have a full course available on this topic called Trading & Investing Automation for AmiBroker, where you can get additional information and programming example scripts. This and much more are all part of our educational content...
If you want access to our educational content, growing library of ACTIONABLE Strategies and everything that we have to offer... try out our full service and strategies with a no-risk 2-week trial of the Systematic Investing Game Plan membership today for only $14.99 using Coupon Code: secret15)
Here's the Video Presentation...
Session 2 in the video below starts at 36:08 timestamp.
Update: Jan 12 2021
Here's an edited version of the above presentation...
Enjoy,
Dave
Systematic Investors Group Team
