NDX Momentum Strategy: An Analysis of Different Models
( Guest Blog Post by Mountain Trading Group )
The start of 2021 has been hard on bonds (TLT). It has also been hard on the Nasdaq-100 (NDX). TLT thus far is down about 12.5% YTD (including dividends) and is currently experiencing a drawdown of 19% with the last high occurring on August 4th, 2020. NDX is down about 4.6% YTD and is currently experiencing a drawdown of 11.2% with the last high occurring February 12th, 2021.
The NDX Momentum strategy has been in risk-off mode since October 2020 meaning it has been invested in TLT as a cash equivalent. The performance has been disappointing but not necessarily out-of-character. When I look at the historical TLT periods, the strategy has been in risk-off mode 55 times, 66% of these periods are positive (34% are negative) and the performance for these periods varies from –10.3% to 31.9% with an average return of 2.92% (median of 2.31%) and an average length of 58 trading days (median length of 43 trading days). The current TLT holding has a return of -13% and a holding period of 90 trading days (so as it stands it is the worst performing period of the past 26 years and it is above average in terms of holding period). But this period is still on-going so who knows where it will end up.
As a point of comparison, I thought I would look at different approaches to the strategy:
- Remove the risk-on/risk-off filter completely so the strategy is always in stocks [No Filter]
- Use cash instead of TLT as the cash-equivalent [Filter w/ Cash]
- The current methodology (TLT as cash-equivalent) [Filter w/ TLT]
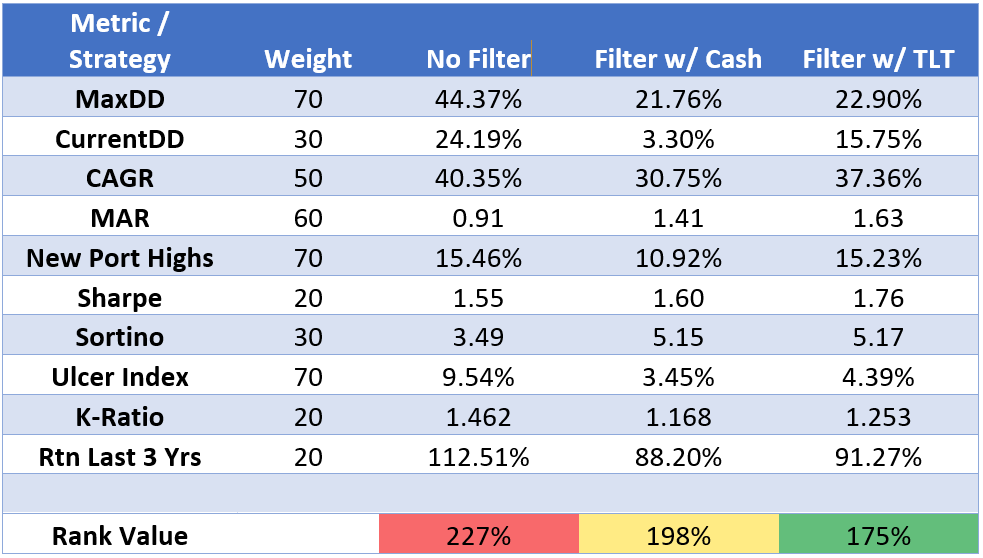
Here are the results of my study (all data as of March 8th, 2021):

The rank value is a weighted sum of rankings for the various metrics (lower is better). I applied weightings based on my gauge of their importance. How much pain am I going to feel from the drawdown (MaxDD), how often will I be feeling good about the strategy (New Portfolio Highs) and to what extent will the strategy leave me with an ulcer (Ulcer Index). These are the metrics that I assigned the highest weight to. Other metrics like Sharpe Ratio, K-Ratio, etc. are nice to know but are not the most important to me.
The best ranked system is the Filter w/ TLT strategy mainly due to its high CAGR, reasonable MaxDD, low Ulcer Index reading, and it is hitting new highs on a regular basis. The Filter w/ Cash strategy ranks highly in many categories, but it suffers from a reduced CAGR and hits new highs less often.
With the filter removed and the strategy continuously trading stocks the CAGR improves but the MaxDD increases to a gut-wrenching 44.37%. It would be exceedingly difficult for me to trade through a drawdown like this and I would be tempted to bail and move to cash (defeating the purpose of having a rules-based systematic strategy). I would rather forgo some of the gains to achieve a MaxDD that can be stomached and allow me to maintain my discipline and continue trading the strategy.
In terms of using a risk-on/risk-off filter versus not using one, it is clear from the model comparison that using the filter has a huge impact on the drawdown performance and overall risk performance of the strategy, while sacrificing little overall performance. Even during this difficult period in bonds, with the recent selloff in the NDX and the volatility in the previously high-flying tech stocks the drawdown for the risk-off strategy is running more than 8% better than the risk-on (no filter) strategy.
As a reminder, trading any strategy can be exceedingly difficult and the drawdown periods can test anyone’s patience.
The key to success comes down to patience and discipline: patience to ride out the prolonged drawdown periods knowing that better times and new highs are ahead; discipline to stick with a tested strategy through difficult trading environments, facing the fear of loss and refusing to give in to the urge to give up.
Gary
Mountain Trading Group

Thanks for posting this. It is reassuring to look at the hard data when your will to hold on is being tested by market conditions.